TimeGraph: A Computer Vision Pipeline for Quantifying Territorial Dynamics from Animated Historical Maps (In progress)
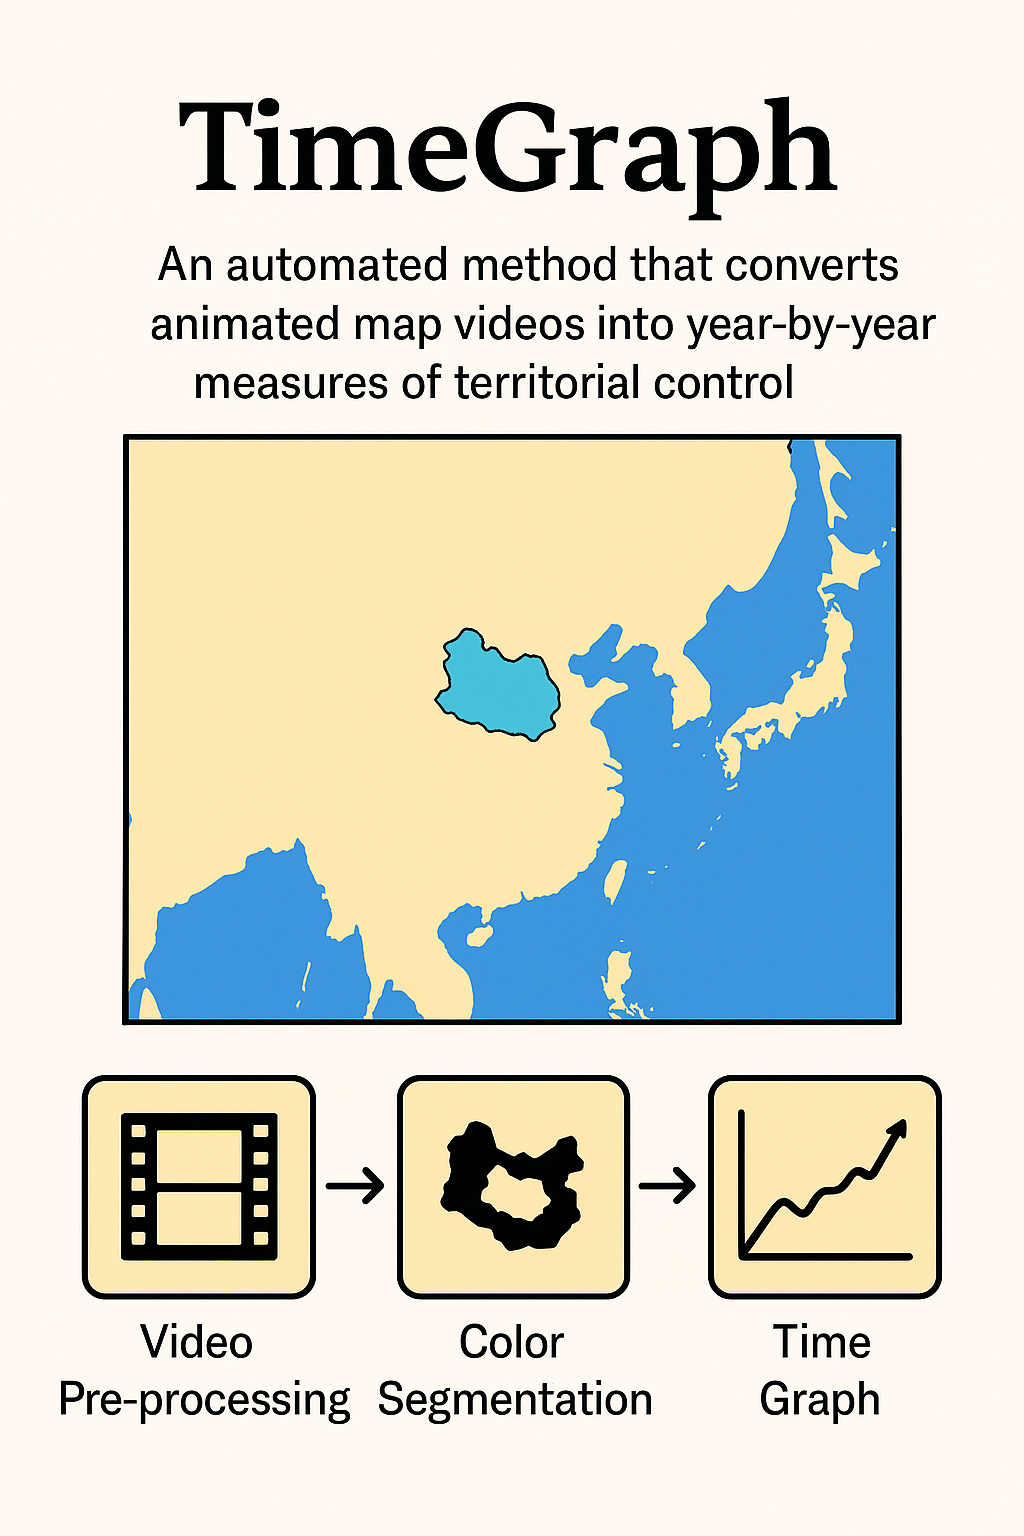
We present the TimeGraph, an automated method that converts publicly available animated map videos into year-by-year measures of territorial control. The approach requires no pre-existing shapefiles and generalizes to map videos given seed colors, opening large-scale, reproducible territorial datasets for historians, economists, and political scientists